Next.js Monitoring: From Setup to Visualization with Prometheus and Grafana

Monitoring is an essential aspect of maintaining the health and performance of your web applications. It's important because it helps you catch problems before they become big issues. It also makes sure your programs run smoothly with optimized resources, and your users have a good experience. This blog post will introduce you to two powerful tools, Prometheus and Grafana, which can be used together to help you monitor and maintain the health of your Next.js applications and will guide you through the process of integrating Prometheus with your Next.js application for effective monitoring.
Introduction to Prometheus
Prometheus is a monitoring system and time series database that collects and stores metrics from your application. It keeps track of what's happening in your software over time so you can monitor not only the metrics defining vital server health indicators like CPU usage and memory usage but also custom metrics like success rates of your APIs or page loads. Prometheus excels at real-time monitoring enabling timely alerts, and data visualization, making it a popular choice for monitoring solutions.
How Does it work
The Prometheus server gathers metrics from various sources, including your servers and other monitoring targets, by periodically fetching data from their metric endpoints using HTTP requests, following a predefined schedule. However, when dealing with transient or short-lived jobs that can't be regularly polled for metrics, Prometheus offers a solution called the Push gateway. This intermediary server allows monitoring targets to send their metrics before they terminate. For our case, we stick to the implementation using the Prometheus pull method.
Prometheus als offers a powerful querying capability through PromQL (Prometheus Query Language). This functional query language enables the real-time selection and aggregation of time series data.
Now that we have grasped the essence of Prometheus let's start with the process of integration of prom-client with our next js app. We will be using a popular npm library “prom-client” for our integration.
Implementation
Before we dive into the practical steps of setting up Prometheus monitoring for your Next.js application, let's take a moment to understand the requirements of the 'prom-client' package.
Data Collection: 'prom-client' provides a simple way to collect and send important performance data from your application to Prometheus. This data includes things like response times, error rates, and custom metrics unique to your app.
It automatically collects the server health metrics like CPU and memory usage, event loop lags and many more.Standardization: It standardizes the way your application reports data, ensuring Prometheus can understand and process it correctly.
Efficiency: 'prom-client' is designed to be efficient, so it won't slow down your application. It gathers data in the background, ensuring your app's performance isn't compromised.
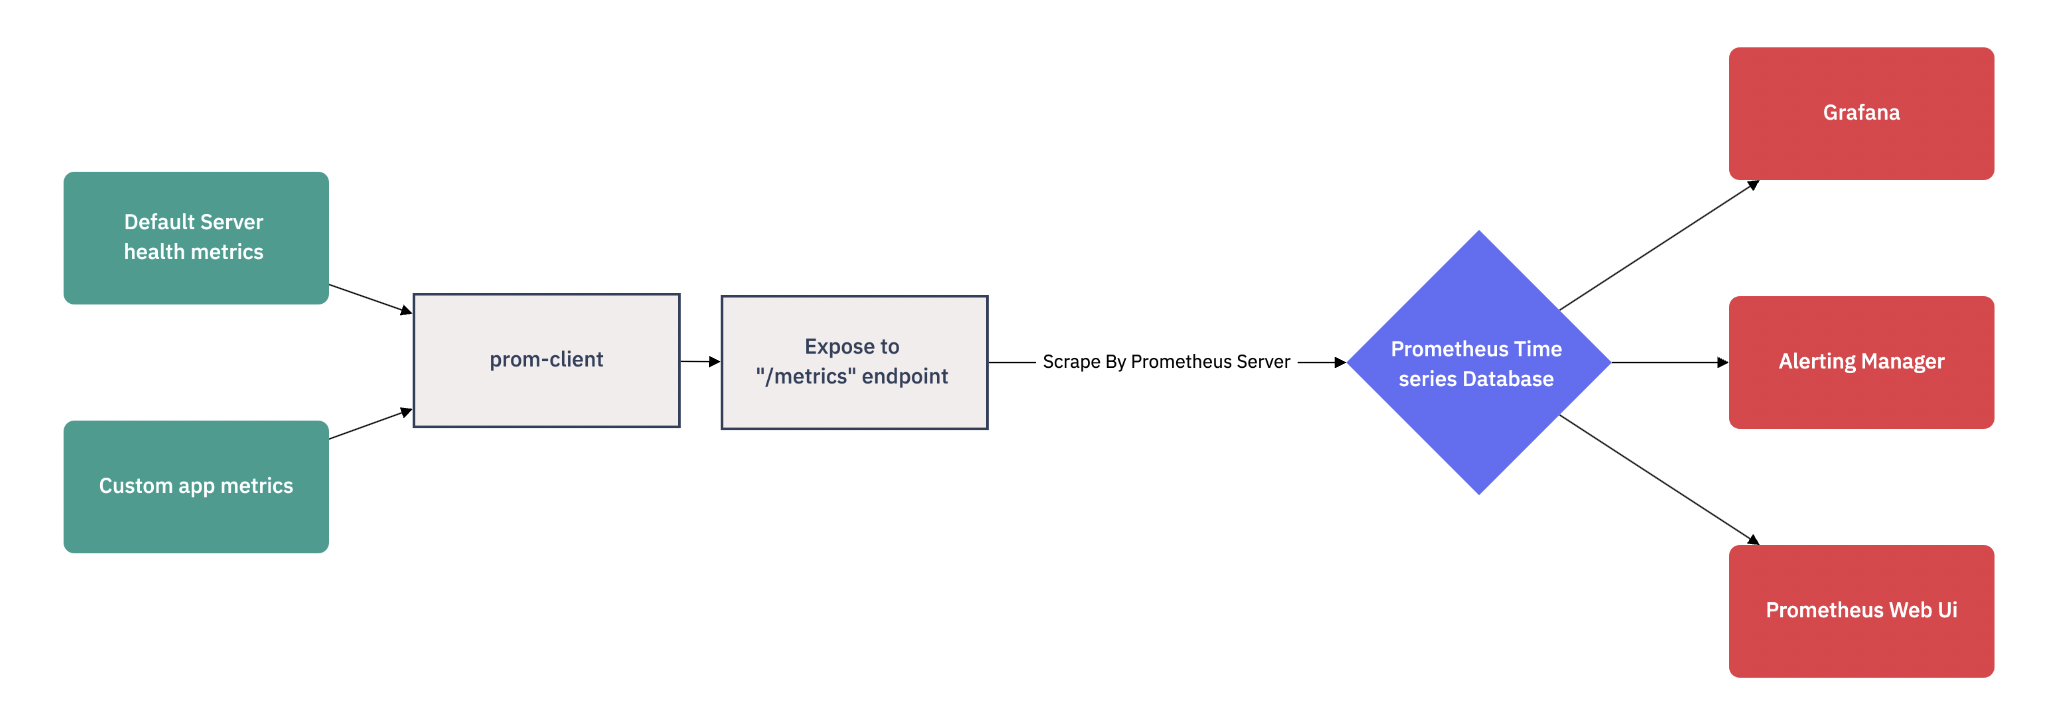
So we can summarize the architecture of our setup as follows:
Step 1: Installing ‘prom-client’
The prom-client npm module can be installed via:yarn add prom-client
Step 2: Exposing metrics endpoint
In your Next.js application, you need to create a route for exposing metrics. For example, create a file named 'metrics.ts' in our API directory and use the following code snippet which will expose all the metrics collected from our application.
To collect predefined metrics available with prom-client you can simply use the collectDefaultMetrics functions as mentioned in the following code. Also, we can see a prefix passed as a param to the function which will be included in the name of our metrics and help us differentiate our metrics from the metrics of other applications.
import { NextApiRequest, NextApiResponse } from 'next';
import { register, collectDefaultMetrics } from 'prom-client';

collectDefaultMetrics({ prefix: 'web_server_' });

export default async function handler(_: NextApiRequest, res: NextApiResponse) {
    res.setHeader('Content-type', register.contentType);
    res.setHeader('Cache-Control', 'no-store');
    res.send(await register.metrics());
}
We are going to configure the '/metrics' endpoint for Prometheus but the current route will be '/api/metrics' so let's add a rewrite for this route in our next.config.js file as follows:
    async rewrites() {
        return [
            {
                source: '/metrics',
                destination: '/api/metrics',
            },
        ];
    },
Step 3: Adding Custom Metrics
In addition to the default metrics provided by Prometheus client libraries, you can create custom metrics to monitor specific events or actions in your Next.js application. So Let's add a custom counter metric to track the number of successful and failed requests and a histogram metric to get the insights for server processing times. Before proceeding further let’s understand these counter and histogram metrics provided by Prometheus:
Counter Metric: A counter in Prometheus is a metric used to count the cumulative number of events or occurrences over time. Counters always start at zero and only increase, never decreasing. They are commonly used for tracking things like the number of requests served or errors encountered. With Prometheus, you can query counters to retrieve the total count of events within specific time windows, allowing you to calculate event rates or deltas to understand their frequency. In our case, we are going to monitor the error rates for our server apps or pages.
Implementation
Create a Prometheus Service file where we can define our counter metric. The code below sets up a Prometheus Counter metric named 'web_server_events' with labels 'event' and 'statusCode'. The metric counts occurrences of server events and their associated status codes. The 'sendPrometheus' function increments this counter based on provided 'logDetails', which include the event type and status code. This 'sendPrometheus' function can be used to trigger counter metrics for our event and the 'statusCode'.Histogram metric: A histogram in Prometheus is a metric designed to measure the distribution of values over a specified range. Instead of counting individual occurrences, histograms group values into predefined buckets, and a counter keeps track of the number of observations within each bucket. Histograms are useful for understanding the spread of data, such as response times or request latencies. You can query Prometheus histograms to obtain information like quantiles, percentiles, and the overall distribution, helping you identify outliers or assess the data distribution's characteristics. In our case also we are trying to monitor the distribution of the server-side processing time of our page or API requests.
Implementation
In the Prometheus service file, we can create an additional Prometheus histogram metric as shown in the code below. We can set up a Prometheus histogram metric called 'web_server_processing_time' with specific settings like labels and buckets for response time data. Then we export a function called sendPrometheusResponseTime, which takes an object containing event details, including response time. The function records the response time in the histogram, categorizing it by event type and status code.import { register, Counter, Histogram } from 'prom-client'; import { CounterLogDetailsType, HistogramLogDetailsType } from 'types'; const counter = new Counter({ name: 'web_server_events', help: 'web_server_events server api counter', labelNames: ['event', 'statusCode'], }); const histogram = new Histogram({ name: 'web_server_processing_time', help: 'web_server data fetching and processing time', labelNames: ['event', 'statusCode'], buckets: [0.1, 5, 15, 50, 100, 250, 500, 750, 1000, 1500, 2000, 5000, 10000, 15000, 20000], }); register.registerMetric(counter); export const sendPrometheus = (logDetails: CounterLogDetailsType) => { try { const { event, statusCode } = logDetails || {}; counter.labels(event, statusCode).inc(); } catch (error) { console.log('Prometheus counter event error', error); } }; export const sendPrometheusResponseTime = (logDetails: HistogramLogDetailsType) => { try { const { event, statusCode, responseTime } = logDetails || {}; histogram.labels(event, statusCode).observe(responseTime); } catch (error) { console.log('Prometheus Histogram event error', error); } };
Step 4: Configure Prometheus Scraping
Now that your Next.js application is instrumented to expose metrics, you need to configure Prometheus to scrape these metrics. Prometheus is available as a docker image. Check out the installation guide for detailed steps. Now you configure Prometheus via a YAML file as shown in the following code snippet:
scrape_configs:
  - job_name: frontend_metrics
    honor_timestamps: true
    scrape_interval: 1m
    scrape_timeout: 10s
    metrics_path: /metrics
    scheme: http
    follow_redirects: true
    enable_http2: true
    static_confis:
      - targets:
        - abc.co # Domain of your website
Step 5: Visualize Metrics using Grafana dashboards
With Prometheus collecting metrics from your Next.js application, you can now visualize these metrics using tools like Grafana. Configure Grafana to connect to Prometheus as a data source and create custom dashboards to monitor your application's performance. Some default metrics are provided by Prometheus and their query for Grafana.
CPU Usage:
The default prom-client metric 'process_cpu_seconds_total' provides the Total user CPU time consumed by the process in seconds. To get the CPU usage percentage we can use the following query:
irate(web_server_process_cpu_seconds_total[2m]) * 100Memory Usage: We get multiple memory-related metrics including heap, process resident memory, and external memory from the default prom-client metrics. So we can monitor any of them by simple query as mentioned below for the process resident memory which is broadly the total RAM used by the server.
avg(web_server_process_resident_memory_bytes{})Event loop lag: This is the lag in event loop processing time in seconds. It is an important metric which depicts if we have any lag in our system.
avg(web_server_nodejs_eventloop_lag_seconds{})Api Success rate: To get the success rate of our custom page load event from the counter metric we can use the following query:
sum by (event) ((increase(web_server_events{statusCode = "200"}[5m]))*100) / sum by (event)(increase(web_server_events{}[5m]))Response time percentile: Percentile graphs generated using histograms in Prometheus play a crucial role in understanding and monitoring the performance of server response times. We can easily create these graphs using the histogram_quantile query function provided by the prom ql library:
histogram_quantile((0.95),sum (rate ( web_server_processing_time_bucket{event="homeLoad"}[5m] )) by (le, event))
Conclusion
Integrating Prometheus with your Next.js application can provide valuable insights into its performance and health. By instrumenting your application with Prometheus client libraries and configuring Prometheus to scrape metrics, you'll be able to monitor key metrics and make informed decisions to improve your application's performance.
Remember that effective monitoring is an ongoing process. Continuously analyze the collected metrics, set up alerts, and fine-tune your monitoring setup to ensure your Next.js application remains robust and responsive.
Happy monitoring!